 What’s going on with home prices in Durham?
Because I used to track activity pretty closely in Ordinary Durham’s Hope Valley Farms I had in mind that the cost per square foot of homes sold in the subdivision way back when was about $117. I’ve also had several listings in the last few years that I had difficulty pricing and I began to wonder whether home prices had really come back. This issue is on a lot of people’s minds since the county sent out notices of the new assessed values, which are one factor in setting the tax rate.
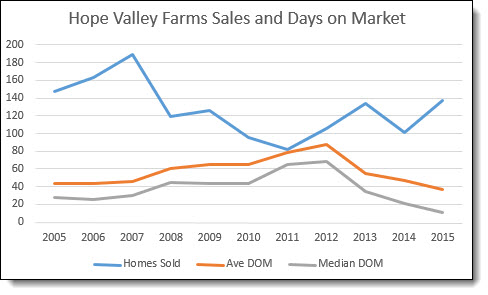
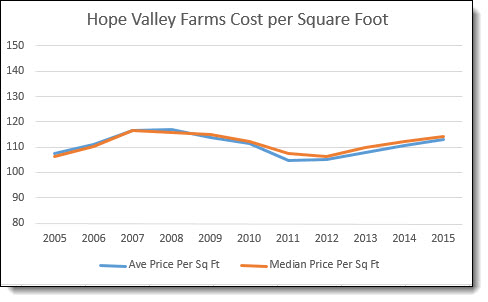
Curious, I went to the MLS and did a search of the homes sold in Hope Valley Farms in 2015. The average square foot cost of the 148 homes sold was $113.04. To confirm my memory, I ran the same search for all homes sold in 2005, before the recession took hold. In that year 137 homes sold with an average square foot cost of $107.31. Hmm…
So I started running the search for the intervening years. It gives a clue to what impact the recession had on home sales in Durham. An analysis of Hope Valley Farms doesn’t tell the whole story but it serves as something of a proxy because it is one of Durham’s largest subdivisions. Also, few new homes have been built in it since the recession. The homes themselves are similar in style and sizes and the lot sizes are pretty consistent. And each end of it is close to shopping and other amenities.
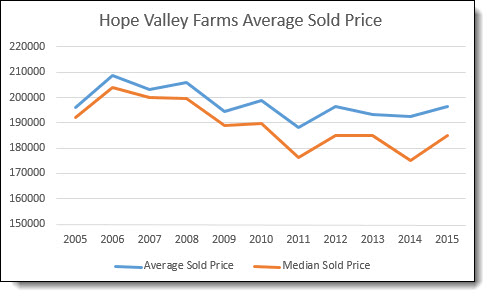
The four charts below tell the story. The low point was 2011 when the number of sales bottomed out and the days on market was peaking. Both the average and the median sales prices hit their lows. Ditto for the Cost per square foot.
The peak for Average Cost Per Square Foot was in 2007 and 2008 at about $116. The low point in 2011 and 2012 was about $105 and has been recovering since then to the current $113.
What is harder to explain is how the county assessments overall took a 15% jump. Hope Valley Farms is one of Durham’s most popular subdivisions and the average price for all homes sold in 2007 (when the last assessment was done) is almost 3.25% below the 2015 average. It might be explained by the fact that there hasn’t been significant new construction in Hope Valley Farms in some time and that new homes in new neighborhoods is where the increase is coming from. That’s an analysis for another day.
Way back when you could test the reasonableness of a competitive market analysis that you were doing for a client using a rule of thumb for appreciation. Here in Durham 3% to 4% per year was often used. However, judging from the numbers here, if you haven’t already, you better limit your idea of the return on investment in your home to the joy it gives you and the memories you create there.
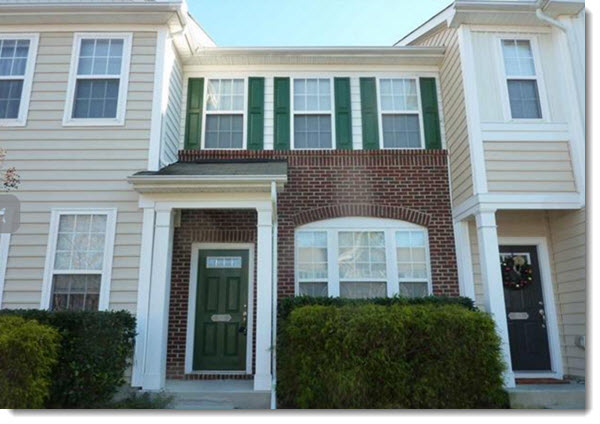
At this writing there are only 12 homes active on the market in the Multiple Listing Service and 8 of the 12 are townhomes including the one shown in the picture above. Click here for more information about those homes.
Note: This analysis uses data from the Triangle Multiple Listing Service and does not include sales that are not handled through a Realtor. Since the vast majority are, the data provides a good enough sample to view trends.


